
Photo by Ludovic Migneault on Unsplash
Social Sharing block
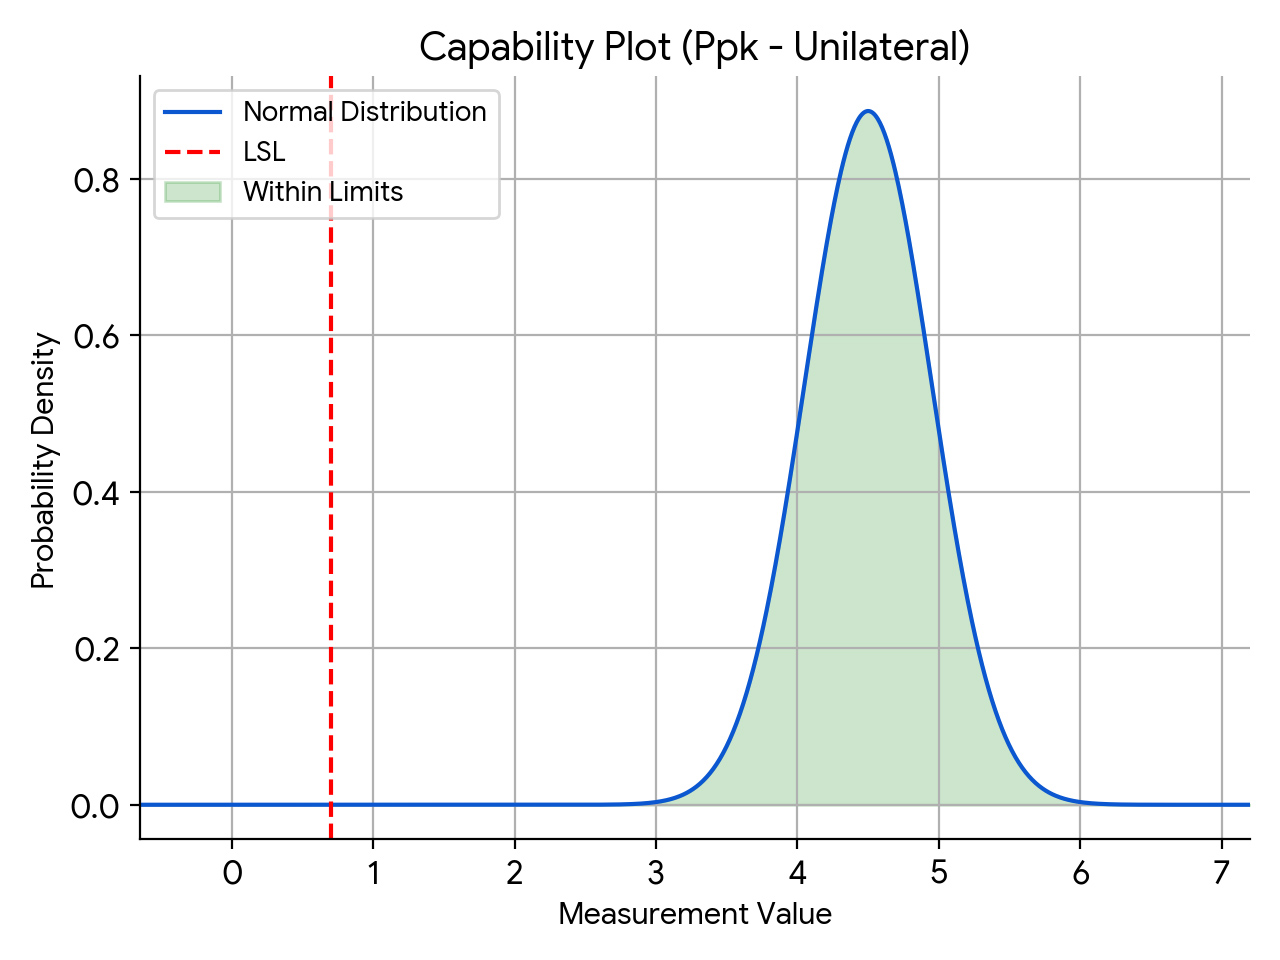
In this article, I’m looking at the relationship between capability index (Cpk or Ppk) and tolerance intervals. The capability index is tied to the specification limits, and tying this to the tolerance interval enables us to use the confidence/reliability statement allowed by the tolerance interval calculation.
|
ADVERTISEMENT |
Consider the following scenario:
A quality engineer is tasked with assessing the capability of a sealing process. The requirement the engineer is used to is that the process capability index, Ppk, must be greater than or equal to 1.33. The engineer is accustomed to using 30 as the sample size.
But what does this really tell us about the process? Is 1.33 expected to be the population parameter? If so, does testing 30 samples provide us with this information? The capability index calculated from 30 samples is only the statistic, and not the parameter.
We can use the tolerance interval calculation approach here and calculate the one-sided k-factor for a sample size of 30. Let’s assume that we want to find the tolerance interval that will cover 99.9% of the population with 95% confidence. NIST provides us with a handy reference to calculate this, and we can use an Excel spreadsheet to do so. We see that the one-sided k-factor calculated is 4.006.
The relationship between the required Ppk and the one-sided k-factor is:
Ppk required = k1/3
Similarly, for a bilateral specification, the relationship between the required Ppk and the two-sided k-factor is:
Ppk required = k2/3
In our example, the required Ppk is 1.34. In other words, if we use a sample size of 30 and show that the calculated Ppk is 1.34 or above, we can make the following statement:
With 95% confidence, at least 99.9% of the population conforms to the specifications. In other words, with 95% confidence, we can claim at least 99.9% reliability.
This approach is also used for variable sampling plans. However, note that the bilateral specification also requires an additional condition to be met for variable sample plans.
I have attached a spreadsheet that will enable you to perform these calculations easily. I welcome your thoughts. Please note that the spreadsheet is provided as-is with no guarantees.
Final words
I’ll finish with the history of the process capability indices, as outlined in a great article by Roope M. Turunen and Gregory H. Watson.
“The concept of process capability originated in the same Bell Labs group where Walter A. Shewhart developed SPC. Bonnie B. Small led the editing team for the Western Electric Statistical Quality Control Handbook, but the contributor of the process capability concept is not identified. The handbook proposes two methods by which to calculate process capability: first, ‘as a distribution having a certain center, shape, and spread,’ and second, ‘as a percentage outside some specified limit.’ These methods were combined to create a ratio of observed variation relative to standard deviation, which is expressed as a percentage.
“The handbook does not call the ratio an index; this terminology was introduced by two Japanese quality specialists in their 1956 conference paper delivered to the Japanese Society for Quality Control (JSQC). M. Kato and T. Otsu modified Bell Labs’ use of percentage and converted it to an index, and proposed using that as a Cp index to measure machine process capability. Subsequently, in a 1967 JSQC conference paper, T. Ishiyama proposed Cpb as a measurement index of bias in nonsymmetric distributions. This later was changed to Cpk, where k refers to the Japanese term katayori, which means ‘offset’ or ‘bias.’”
Always keep on learning....
Published April 21, 2024, on Harish’s Notebook.
Comments
Interesting. Is there a…
Interesting. Is there a reference for the relationship used: Ppk required = k1/3? Thanks.
Reference
Hello Subha,
A good reference is https://www.astm.org/f3172-15r21.html.
Thanks,
Harish
Jose, Cpk, Ppk and…
Jose,
Cpk, Ppk and tolerance interval statistics are calculated from samples. The samples may not come from a process in statistical control. Therefore the calculated statistics may not be reliable. Statistical control should first be assessed by process behavior charts.
Best,
Stan Alekman
Hi Stan, I agree. My post…
Hi Stan,
I agree. My post was not necessarily about that aspect though.
Thanks,
Harish
Cpk linked to tolerance intervals
You have neglected to mention that the index is only valid following an assessment of the stability of the underlying process! This is not a given and requires constancy of purpose and effort.
Confidence interval for process capability metrics
Davis Bothe's book Measuring Process Capability has the confidence interval formulas for process capability metrics. The easiest one is for Cp because you only have to estimate one parameter (the population standard deviation). The other intervals are wider but calculating the Cp interval is enough to show that to obtain a useful confidence interval (one sufficiently narrow to indicate a unique interpretation over its range) you need a very large sample size. For 10% precision with 95% confidence, i.e. P(0.9*Cp_hat < Cp < 1.1*Cp_hat) = 0.95, you need a sample size of about 200 units. Suppose a sample of 200 units delivers estimated Cp Cp_hat = 1.5. The 95% confidence interval (with 10% precision) will be P(1.35 < Cp < 1.65) = 0.95. That's a huge range of possible Cp values considering everything interesting happens between Cp = 1 (awful) and Cp = 2 (spectacular). Process capability with small sample sizes, e.g. n = 30, is delusional unless all of the metrics are very large and you're confident that all of the assumptions (e.g. normality, single stable process, etc.) are satisfied.
If the process capability data are collected under SPC protocol (as they're supposed to be) and there is evidence that the process mean is unstable (Pp << Cp), then you can't use Bothe's simple confidence intervals. In this case there will be two standard deviations - the within-subgroup and the between-subgroup standard deviations - and the confidence intervals have to be determined with appropriate degrees of freedom weighting.
In general, Harish is correct that process capability (with confidence intervals), normal tolerance intervals, and variables sampling plans are all about the same thing - characterizing the proportion defective with respect to specification limits and their results will converge.
To Stan Alekman and Mike M: It's good to see you're keeping track of these things. P.
Add new comment